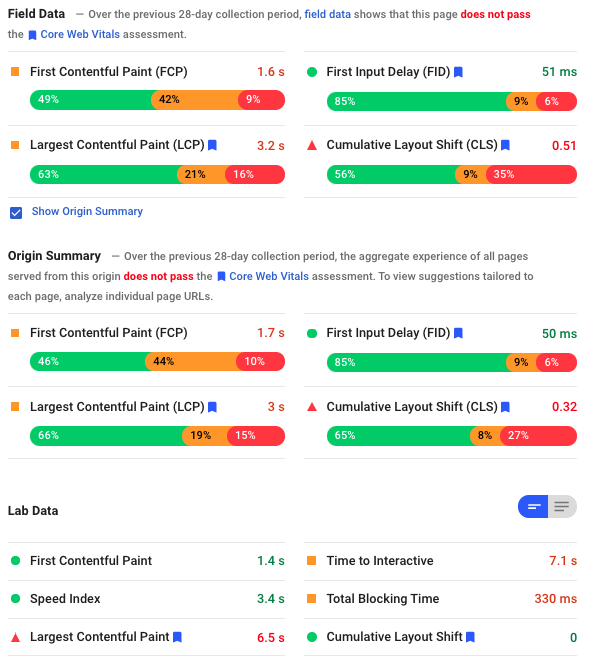
LCP (largest contentful paint) is one of the most important core web vitals, it is the only core web vital that is related 100% to speed and hence it is the most difficult one to diagnose and optimize for. LCP could be measured using Google PageSpeed Insights which is powered by Lighthouse.
LCP should load within 2.5 seconds, if 75% of the loads ( regardless of which pages) on a website achieve that number, LCP will be marked as passing assessment. Only elements within the user viewport (above the fold) will be used to calculate LCP.
Google has provided a great tutorial how to optimize for LCP, in this post I will try to provide a check list and actionable directions that you can implement yourself or take to your web developer that is working on improving Core Web Vitals (mainly LCP).
14 improvements that you can do to improve LCP:
- Adequate resources on the server
- Enable browser caching
- Enable GZIP (text compression)
- Enable server caching like OPcache or reverse proxy
- Keep your software up-to-date (CMS, Plugins, operating system like Ubuntu, control panel like Cpanel, PHP, MySQL and Apache with HTTP2 module)
- Install a server side HTML caching for your CMS
- Setup browser side caching using service worker
- Minify JavaScript and CSS
- Compress images and use the right format for them
- Resize images to fit the required dimensions in the style sheet
- Remove or defer files and codes that block critical rendering path for above the fold content
- Inline critical CSS and critical JavaScript files where possible
- Lazy load images below the fold
- Use CDN for resources like images and JavaScript files or for the whole website
- Fast DNS server
I will provide more details how to improve each of the items above, most of my examples will work best for WordPress that is hosted on Linux with Apache being the web server.
Adequate resources on the server:
You do not need to be cheap when it comes to web hosting, having more resources than what your website needs is better than lacking resources. Start with a VPS, possibly 2 cores, 4 GB of ram and SSD, and keep eye on your resources usage, your average CPU load must stay one or below and your RAM usage must be less than 50% on average. Add more resources if you did not achieve those numbers.
Enable browser caching:
This setup could be done in most cases using the server's configuration, Apache has mod_expires module that enables you to do that by adding the code below to your .htaccess file:
<FilesMatch "\.(webm|ogg|mp4|ico|pdf|flv|jpg|jpeg|png|gif|webp|js|css|swf|x-html|css|xml|js|woff|woff2|otf|ttf|svg|eot)(\.gz)?$">
<IfModule mod_expires.c>
AddType application/font-woff2 .woff2
AddType application/x-font-opentype .otf
ExpiresActive On
ExpiresDefault A0
ExpiresByType video/webm A10368000
ExpiresByType video/ogg A10368000
ExpiresByType video/mp4 A10368000
ExpiresByType image/webp A10368000
ExpiresByType image/gif A10368000
ExpiresByType image/png A10368000
ExpiresByType image/jpg A10368000
ExpiresByType image/jpeg A10368000
ExpiresByType image/ico A10368000
ExpiresByType image/svg+xml A10368000
ExpiresByType text/css A10368000
ExpiresByType text/javascript A10368000
ExpiresByType application/javascript A10368000
ExpiresByType application/x-javascript A10368000
ExpiresByType application/font-woff2 A10368000
ExpiresByType application/x-font-opentype A10368000
ExpiresByType application/x-font-truetype A10368000
</IfModule>
<IfModule mod_headers.c>
Header set Expires "max-age=A10368000, public"
Header unset ETag
Header set Connection keep-alive
FileETag None
</IfModule>
</FilesMatch>
Enable GZIP (text compression):
This setup could be done in most cases using the server configuration, Apache has mod_deflate module that enables you to do that by adding the code below to your .htaccess file:
<IfModule mod_deflate.c>
AddType x-font/woff .woff
AddType x-font/ttf .ttf
AddOutputFilterByType DEFLATE image/svg+xml
AddOutputFilterByType DEFLATE text/plain
AddOutputFilterByType DEFLATE text/html
AddOutputFilterByType DEFLATE text/xml
AddOutputFilterByType DEFLATE text/css
AddOutputFilterByType DEFLATE text/javascript
AddOutputFilterByType DEFLATE application/xml
AddOutputFilterByType DEFLATE application/xhtml+xml
AddOutputFilterByType DEFLATE application/rss+xml
AddOutputFilterByType DEFLATE application/javascript
AddOutputFilterByType DEFLATE application/x-javascript
AddOutputFilterByType DEFLATE application/x-font-ttf
AddOutputFilterByType DEFLATE x-font/ttf
AddOutputFilterByType DEFLATE application/vnd.ms-fontobject
AddOutputFilterByType DEFLATE font/opentype font/ttf font/eot font/otf
</IfModule>
Enable server caching like OPcache or reverse proxy:
Server caching will save popular pages in the memory of the server so they could be served quickly to users, PHP has OPcache that could be enabled to do that.
Keep your software up-to-date:
There is a lot of technology involved in running a website:
- The server and its software (Operating system like Linux, web server like Apache with HTTP2 module, programming language like PHP, database engine like MySQL, control panel like Cpanel and more)
- CMS, like WordPress.
- CMS add-ons like Plugins.
Keeping all this software up-to-date is vital for both performance and security.
Install a server side HTML caching for your CMS:
For a CMS like WordPress to generate a page there will be few PHP calls to the database followed by a HTML version of the page passed by the web server (Apache) to the browser to parse it then render it, this is a long journey with too many variables. Caching a copy of every single page of the website in a HTML format will save a lot for work required by the server and enable it to pass a static HTML file to the browser for rendering, this is a big time saver. A plugin like WPfastest cache or WP Rocket can take care of that for WordPress.
Setup browser side caching using service worker:
The Service Worker API comes with a Cache interface, that lets you create stores of responses keyed by request. Service Worker can even enable the website to work totally off-line after first load.
Minify JavaScript and CSS:
Spaces and comments can inflate CSS and JavaScript files significantly, minifying those files manually or using a plugin if you have WordPress will improve performance. For WordPress WPcache can do the minification.
Compress images and use the right format for them:
Images have different format and purposes, JPEG, PNG, GIFs, SVG, and each of them also has multiple format like JPEG 2000, choosing the right format and resolution could be a huge size saver. For WordPress WPsuper cache plugin has an image compression module that makes image compression an easy process, you can also use plugins like ShortPixel.
Consider using WEBP, It can reduce your image size by 30% comparing to JPEG or PNG.
Resize images to fit the required dimensions in the style sheet:
The image dimensions should always match the required space on the page, having a 1000X1000 pixel images in 100X100 pixel space will add a lot of unnecessary bytes to the total page size.
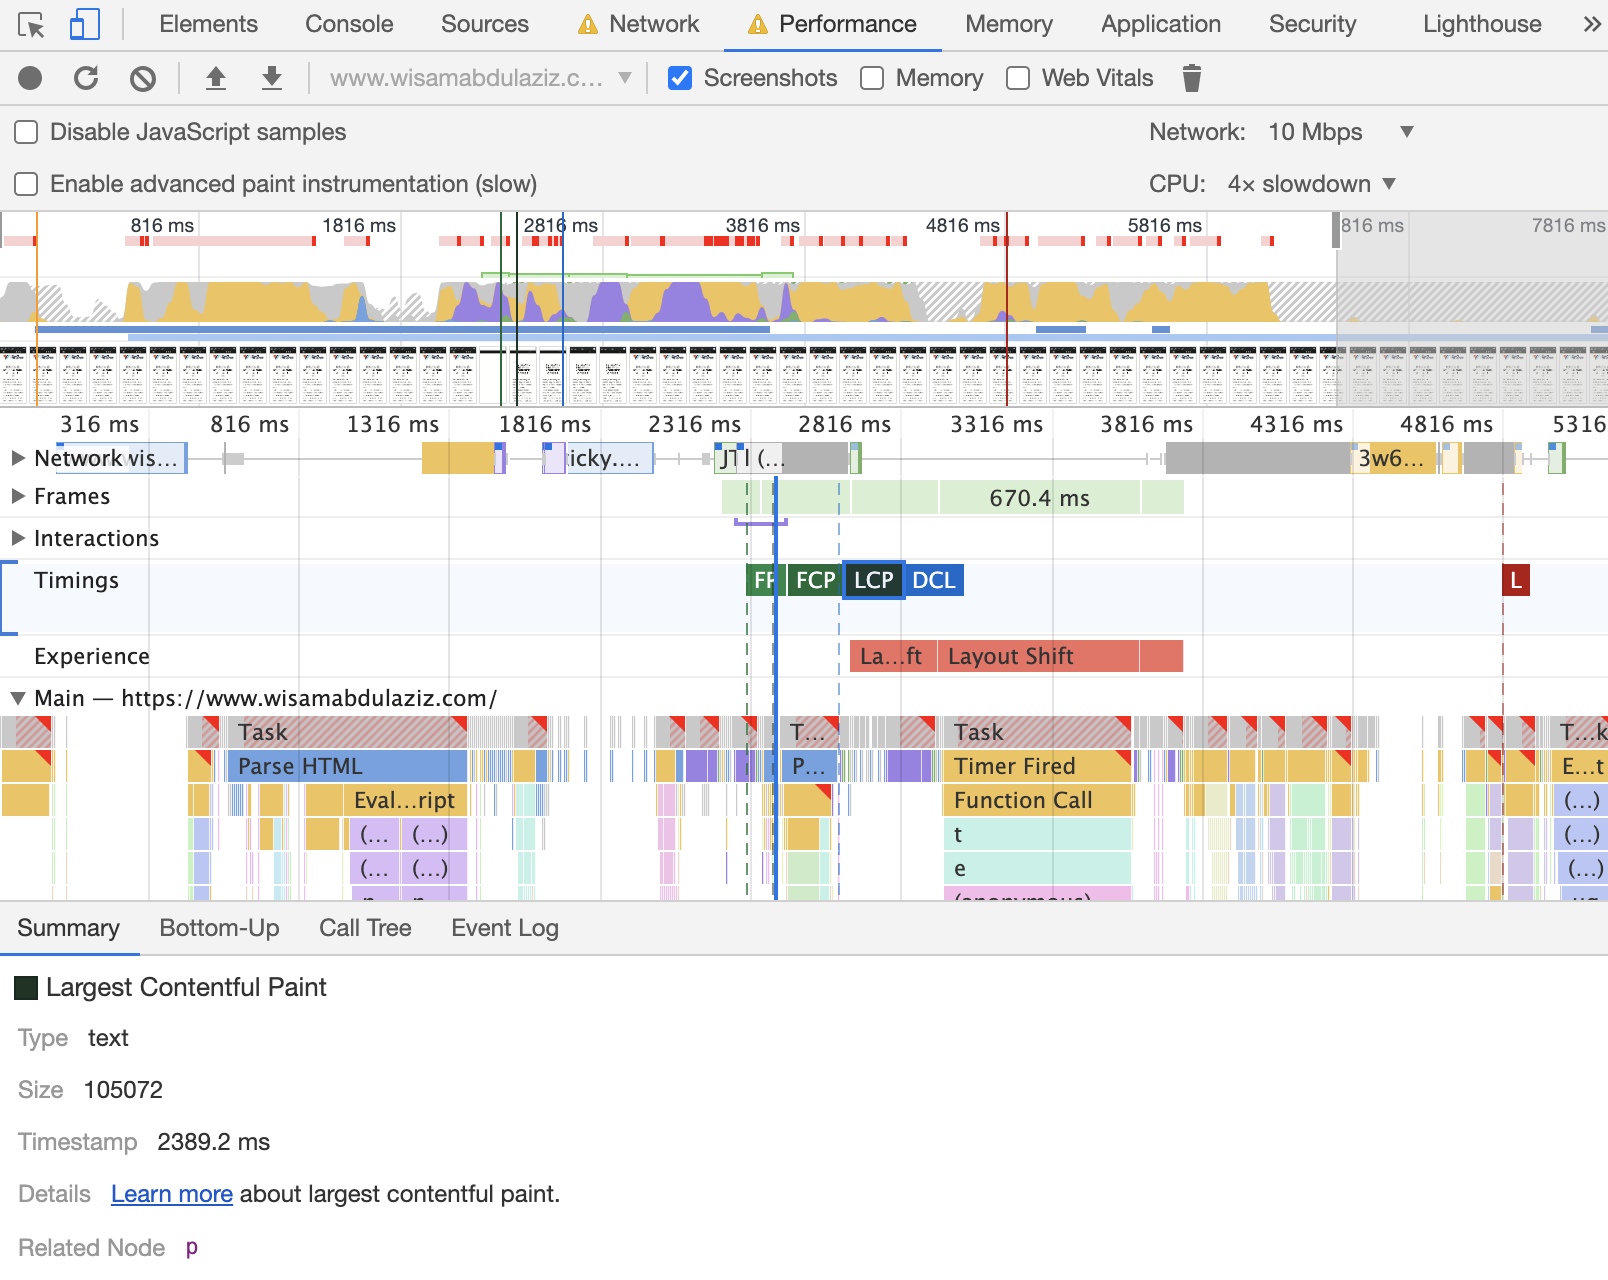
Remove or defer files and codes that block critical rendering path for above the fold content:
Files that are blocking the critical rendering path could be checked using the coverage tab in Chrome Developer Tools:
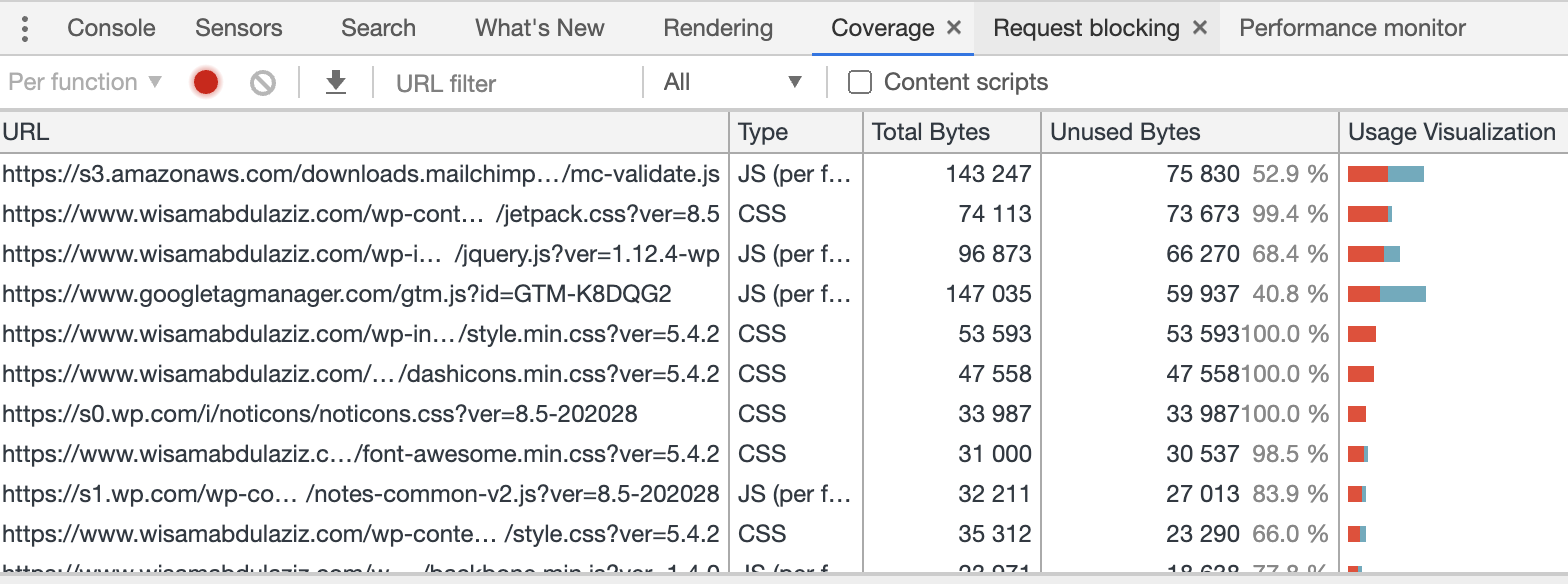
Files that are not used for critical rendering must be deferred. If you have multiple JavaScript files that are partially used for the critical rendering path, you can combine them in two files, one that has all the codes that are required for the critical rendering path critical.js/critial.css and another one that includes codes that are not required for the critical rendering path non-critical.js/non-critial.css, the second file must be deferred.
Consider also preloading files that are required for critical rendering path:
<head>
<link rel="preload" as="script" href="critical.js">

<link rel="preload" href="critical.woff2" as="font" type="font/woff2" crossorigin>

<link rel="preload" href="critical.css" as="style">

<link rel="preload" href="bg-image-narrow.png" as="image" media="(max-width: 600px)">

</head>
You can defer JavaScript and CSS files using the codes below:
<head>
<script src="demo_async.js" async></script>

<link rel="preload" href="styles.css" as="style" onload="this.onload=null;this.rel='stylesheet'">
<noscript><link rel="stylesheet" href="styles.css"></noscript>
</head>
You can also consider inlining CSS and JS codes that are required for the critical rendering path (read more below).
Inline critical CSS and critical JavaScript files where possible:
Web page rendering will be blocked by the browser until all included resources like JS and CSS are fully loaded, having CSS or JS codes that are required for critical rendering path in files will add an extra step to the rendering process which is requesting those file from the server (extra requests to the server). Inlining codes that are required for critical rendering path and put the rest in deferred files will improve website speed.
Lazy load images below the fold:
Images below the fold contributes to page load time but they are not seen by users during the initial page load, lazy loading those images will reduce load time without negatively affecting user experience.
WordPress 5.4 will natively support lazy load, for other CMS you can use a lazy load library or you can use the browser native lazy load attribution:
<img src="image.png" loading="lazy" alt="…" width="200" height="200">Use CDN for resources like images and JavaScript files or for the whole website:
CDN has a lot of features that can help with speed:
- Provide files to users from data centres close to their physical location which improves website speed
- Reduces server load as most files will be served from the CDN's provider servers (normally powerful servers with load balance)
- Firewall with DDOS protection
- Caching content in static HTML (server side caching)
For WordPress Jetpack plugin can provide images and JS files caching, you can also use providers like Cloudeflare which providers a full website caching.
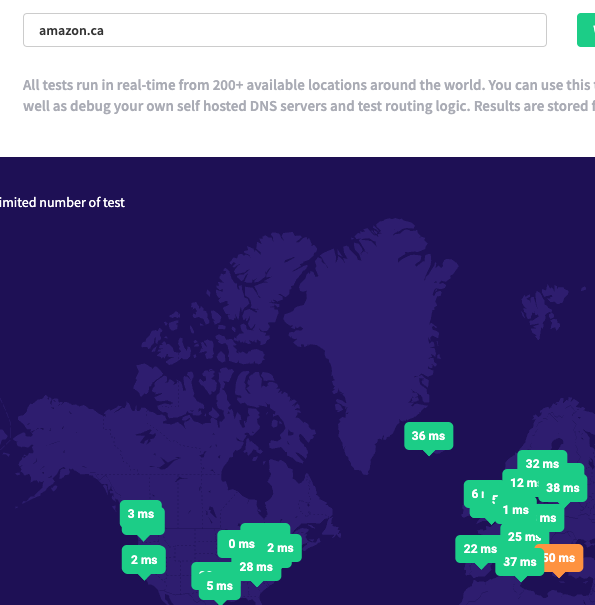
Fast DNS server
DNS is the system that connects readable domain name that human can read and remember (website.com) to an IP (internet protocol) which a machine/computer can understand and handle. This process takes in most cases less than 300 MS, but the difference between a slow DNS and a fast DNS is worth it considering how cheap good DNS providers are. See the screen shot below for Amazon.ca
Summary:
Be aware that optimization for speed is not one and done process, there is always something to improve. Keep monitoring your Core Web Vitals using Google Search Console and make sure your website is having good score.