
PageSpeed insights along with Google Search Console are the best tools when comes to assess a website performance against Core Web Vitals (LCP largest contentful paint, FID first input delay and CLS cumulative layout shift). However the terminology used in those tools could be sometimes confusing to users.
One of the most popular questions when it comes to Core Web Vitals assessment is what is the difference between lap data, field data and origin summary, in this post I will try to answer this question.
Lab data:
Things you need to know about lab data:
- Lab data is empowered by LightHouse technology that simulates mobile throttling with a lower speed. Read more here.
- Lighthouse uses in most cases a slower CPU than the average CPU available for users "Lighthouse applies CPU throttling to emulate a mid-tier mobile device even when run on far more powerful desktop hardware" .
- Lighthouse in most cases will use one location (USA).
- Lab data is generated only for the tested URL in Google PageSpeed Insights tool.
- Lab data is a live data, it reflects the speed at the time the test was run.
- Some users interaction elements like FID will not be visitable in the lab data.
When you run Lighthouse in Google Chrome Developer Tools, at the end of the report you will be able to see the settings that are used in that experiment:
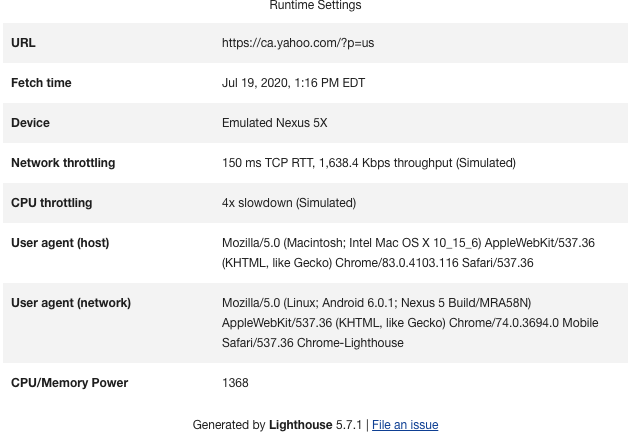
Looking at the settings above we can easily see how Lighthouse is using a slower internet connection and slowing the CPU power by 5 times. The reasons Lighthouse does that is to get the test to cover all online users that use different type of computers and connect to the internet using different levels of speed.
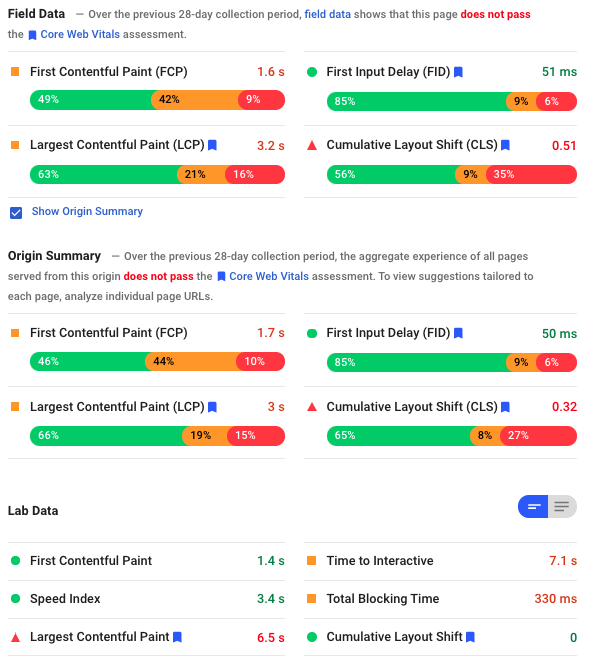
Field data:
Field data is generate by actual Google Chrome everyday users, with:
- Different computers/phones (different resources like CPU, RAM and GPU).
- Different internet speed.
- Different locations.
- Field data is generated only for the URL that is tested in PageSpeed Insights .
- Field data is based on Chrome User Experience Report (CrUX), so it is not live data, it the average user data collected in the last 28 days for the tested URL.
- Google uses the 75th percentile value of all page views to the tested page to produce the score, if at least 75 percent of page views to the tested page meet "good" threshold, the page is classified as having "good" performance for that metric.
So if most of your users coming from a population with a high internet speed and powerful devices, it is normal to see field data better than lab data.
On the other hand if your server is overloaded at the time you are running the test, it is normal to see lab data recording higher numbers than field data.
Original summary:
This is very similar to field data but it represents the average performance of all pages on your website/domain.
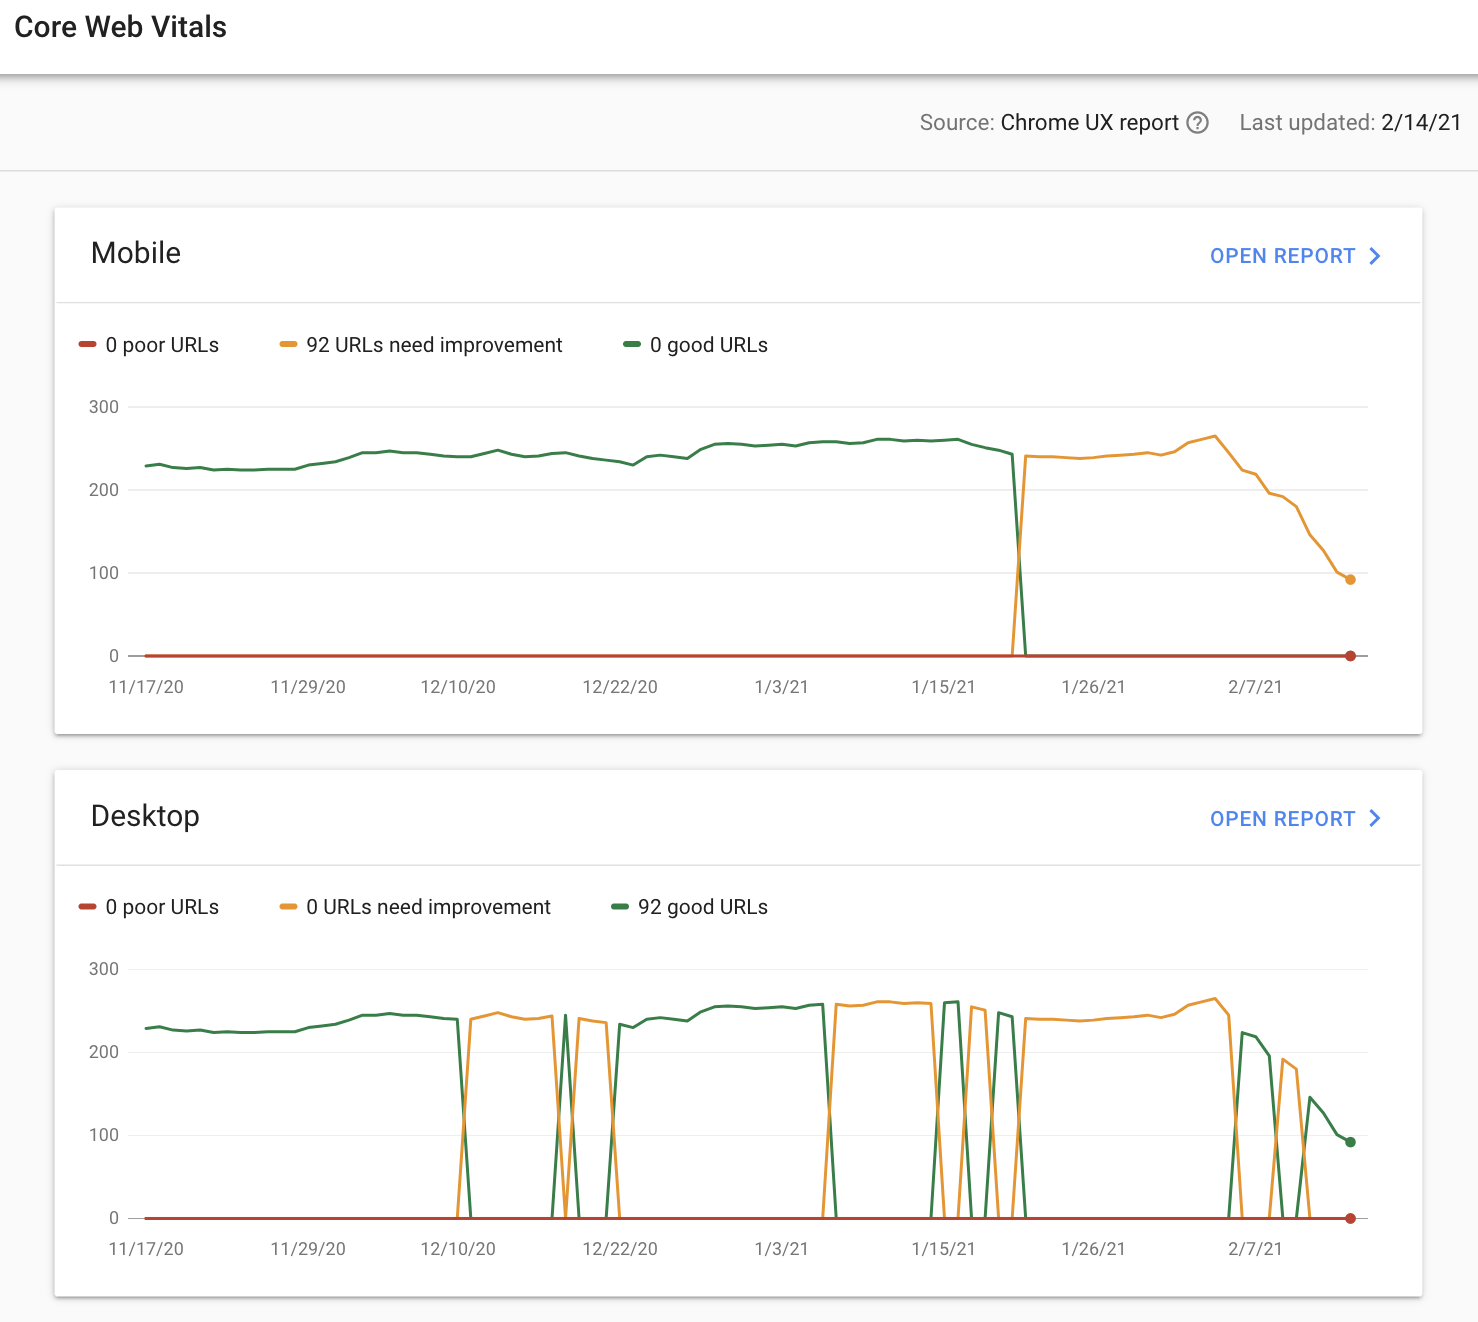
Google uses the 75th percentile value of all page views to that site/domain to produce the score, if at least 75 percent of page views to the tested site meet "good" threshold, the site is classified as having "good" performance for that metric.
The default Core Web Vital charts you see in Google Search Console represents the history of original summary:
Which data set to care mostly about?
Google will be using the field data (CrUX) and original summary data to judge your pages/website, which is also data that is available in Google Search Console.
What I recommend to monitor in the PageSpeed Insights report is the original summary data, which is most likely the data that will be used by Google algorithm updates in the future. It is ok to use lab data while working on speed improvements as you need an instant feed back.
| Field Data | Original Summary | Lap Data | |
| Internet Connection speed | Different connection speed for real-world users | Different connection speed for real-world users | Latency: 150ms Throughput: 1.6Mbps down / 750 Kbps up. |
| Machine Hardware | Different CPU, RAM, GPU, depending or real-world users | Different CPU, RAM, GPU, depending or real-world users | Mid-Tier Mobile (4X slowdown of a high tier desktop) |
| Results time | Average last 28 days | Average last 28 days | Current |
| Location | Real-world user’ location | Real-world user’ location | California |
| Result for | Tested URL | Whole Domain | Tested URL |
Why I do not see field data or origin summary data?
As those two data sets are actual user data coming from Google Chrome Experience Report (CrUX), it is normal for low traffic websites not to see data in one of them or in both of them.
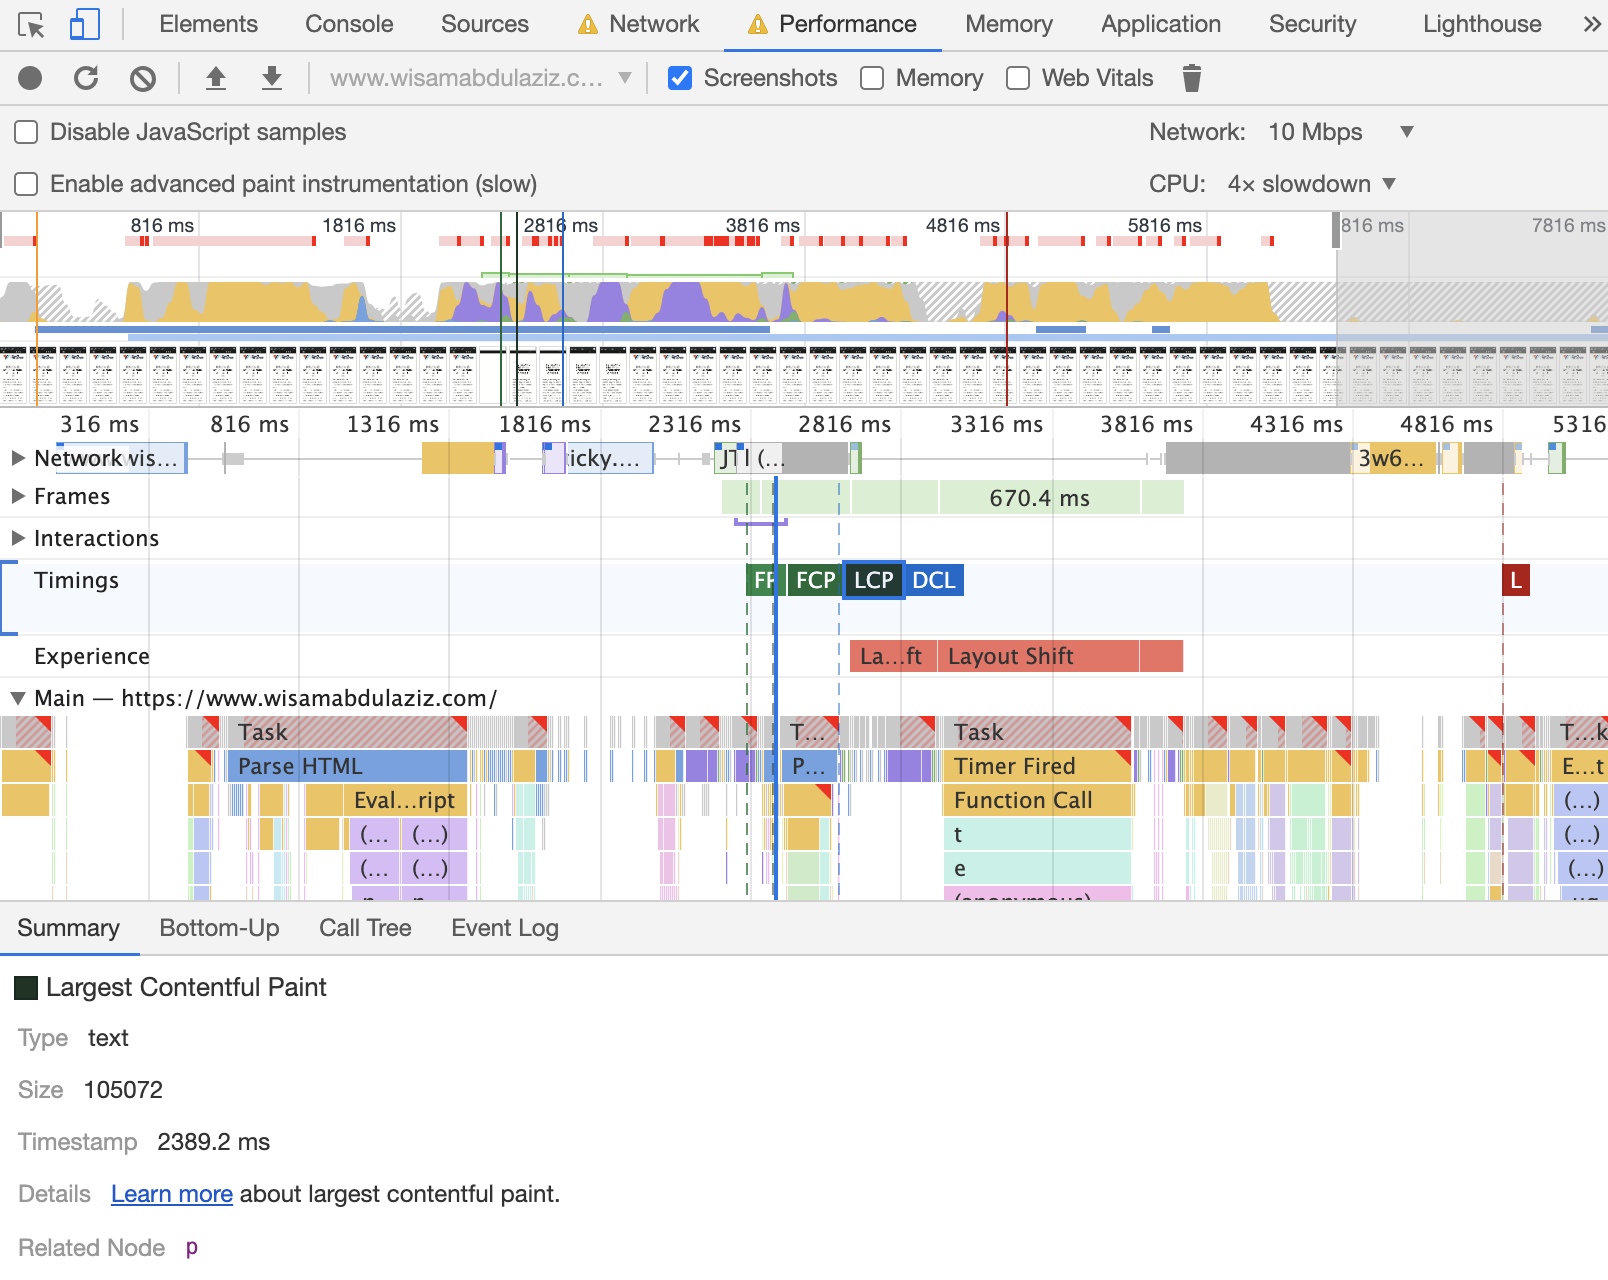
In a situation like that is is recommended to adjust Google Chrome developers tool to match the most popular connection speed used by your users and do a lap test using those settings:
No Comments