Google has been tweaking their algorithm in the last few years toward user experience elements such as:
- Website speed
- Mobile friendliness
- Secure connection HTTPs
Early 2020 Google Chrome team announced Core Web Vitals, following that Google announced that Core Web Vitals will be added as ranking factors to their algorithm along with the old user experience elements, in what the SEOs call page experience update.
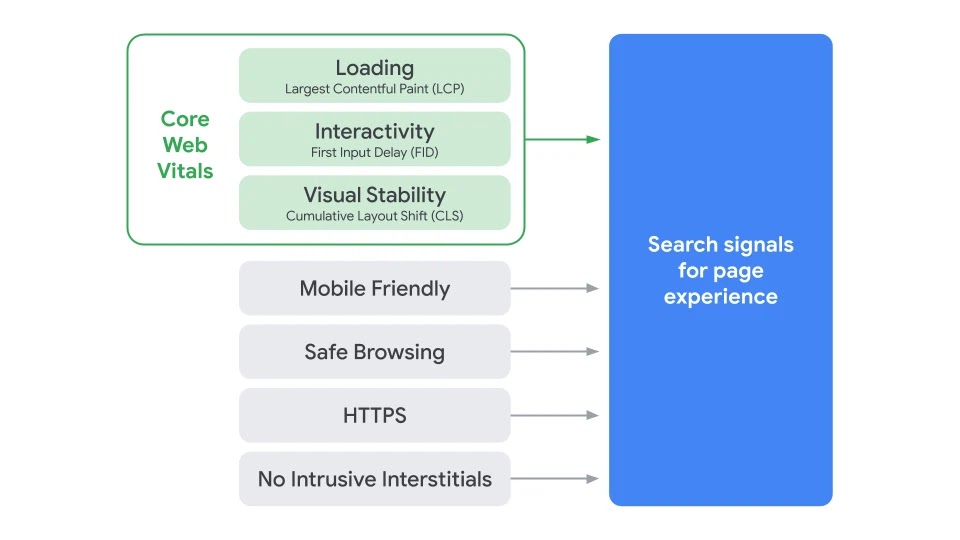
Core Web Vitals measure real world user experience dimensions of web usability, such as load time, interactivity, and the stability of content as it loads. The three core web vitals announced by Google for 2020 are:
- Loading: Largest Contentful Paint (LCP)
- Interactivity: First Input Delay (FID)
- Visual Stability: Cumulative Layout Shift (CLS)
Due to COVID-19 Google will delay launching the new Google algorithm that includes Core Web Vitals (page experience update), and will provide at least six months notice before it rolls out.
How to evaluate Core Web Vitals for a website:
There are many tools that can help with that:
- Google speed insights
- Google Search Console
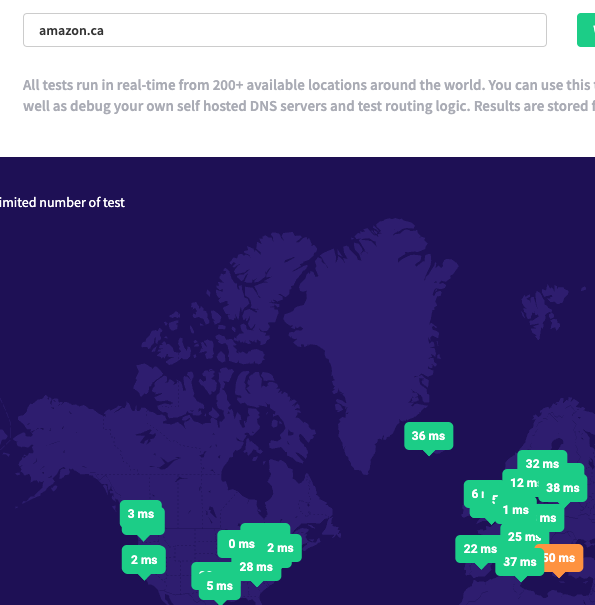
- WebPageTest
- Lighthouse
- Google Developers Tools (it has Lighthouse built in + many other useful tools)
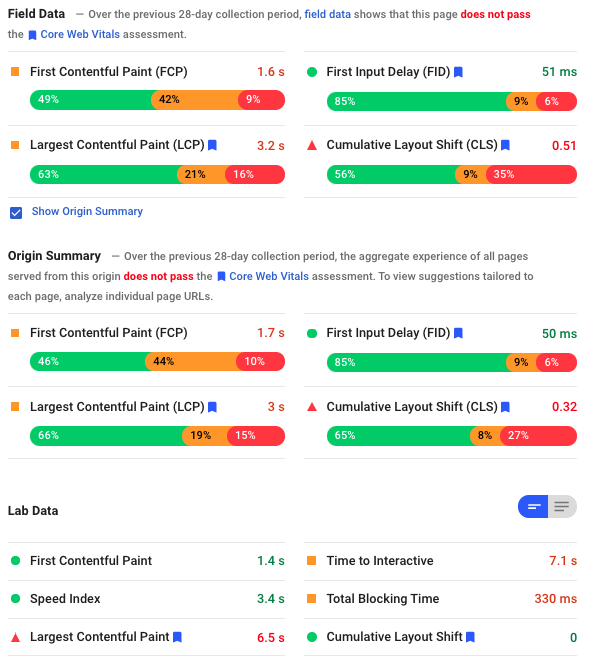
It is very important to understand the difference between lap data and field data before start optimizing for Core Web Vitals.
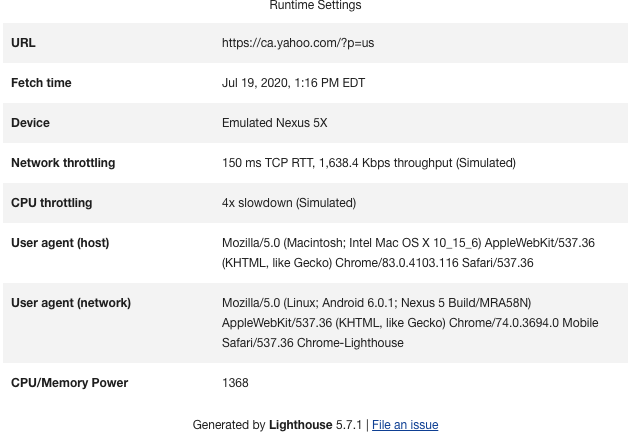
From Google: "The field data is a historical report about how a particular URL has performed, and represents anonymized performance data from users in the real-world on a variety of devices and network conditions. The lab data is based on a simulated load of a page on a single device and fixed set of network conditions. As a result, the values may differ."
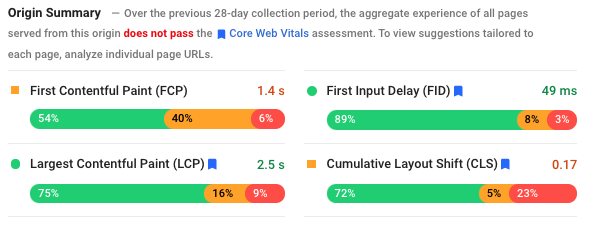
| Field Data | Original Summary | Lap Data | |
| Internet Connection speed | Different connection speed for real-world users | Different connection speed for real-world users | Latency: 150ms Throughput: 1.6Mbps down / 750 Kbps up. |
| Machine Hardware | Different CPU, RAM, GPU, depending or real-world users | Different CPU, RAM, GPU, depending or real-world users | Mid-Tier Mobile (4X slowdown of a high tier desktop) |
| Results time | Average last 28 days | Average last 28 days | Current |
| Location | Real-world user’ location | Real-world user’ location | California |
| Result for | Tested URL | Whole Domain | Tested URL |
1- Loading - Largest Contentful Paint - LCP
"Largest Contentful Paint (LCP): measures loading performance. To provide a good user experience, LCP should occur within 2.5 seconds of when the page first starts loading."
The Largest Contentful Paint (LCP) metric reports the render time of the largest image or text block visible within the viewport (hero element). Website speed used to be monitored using metrics like Speed Index or First Contentful Paint FCP, those metrics are still important to monitor website speed, but the new focus should be improving LCP.
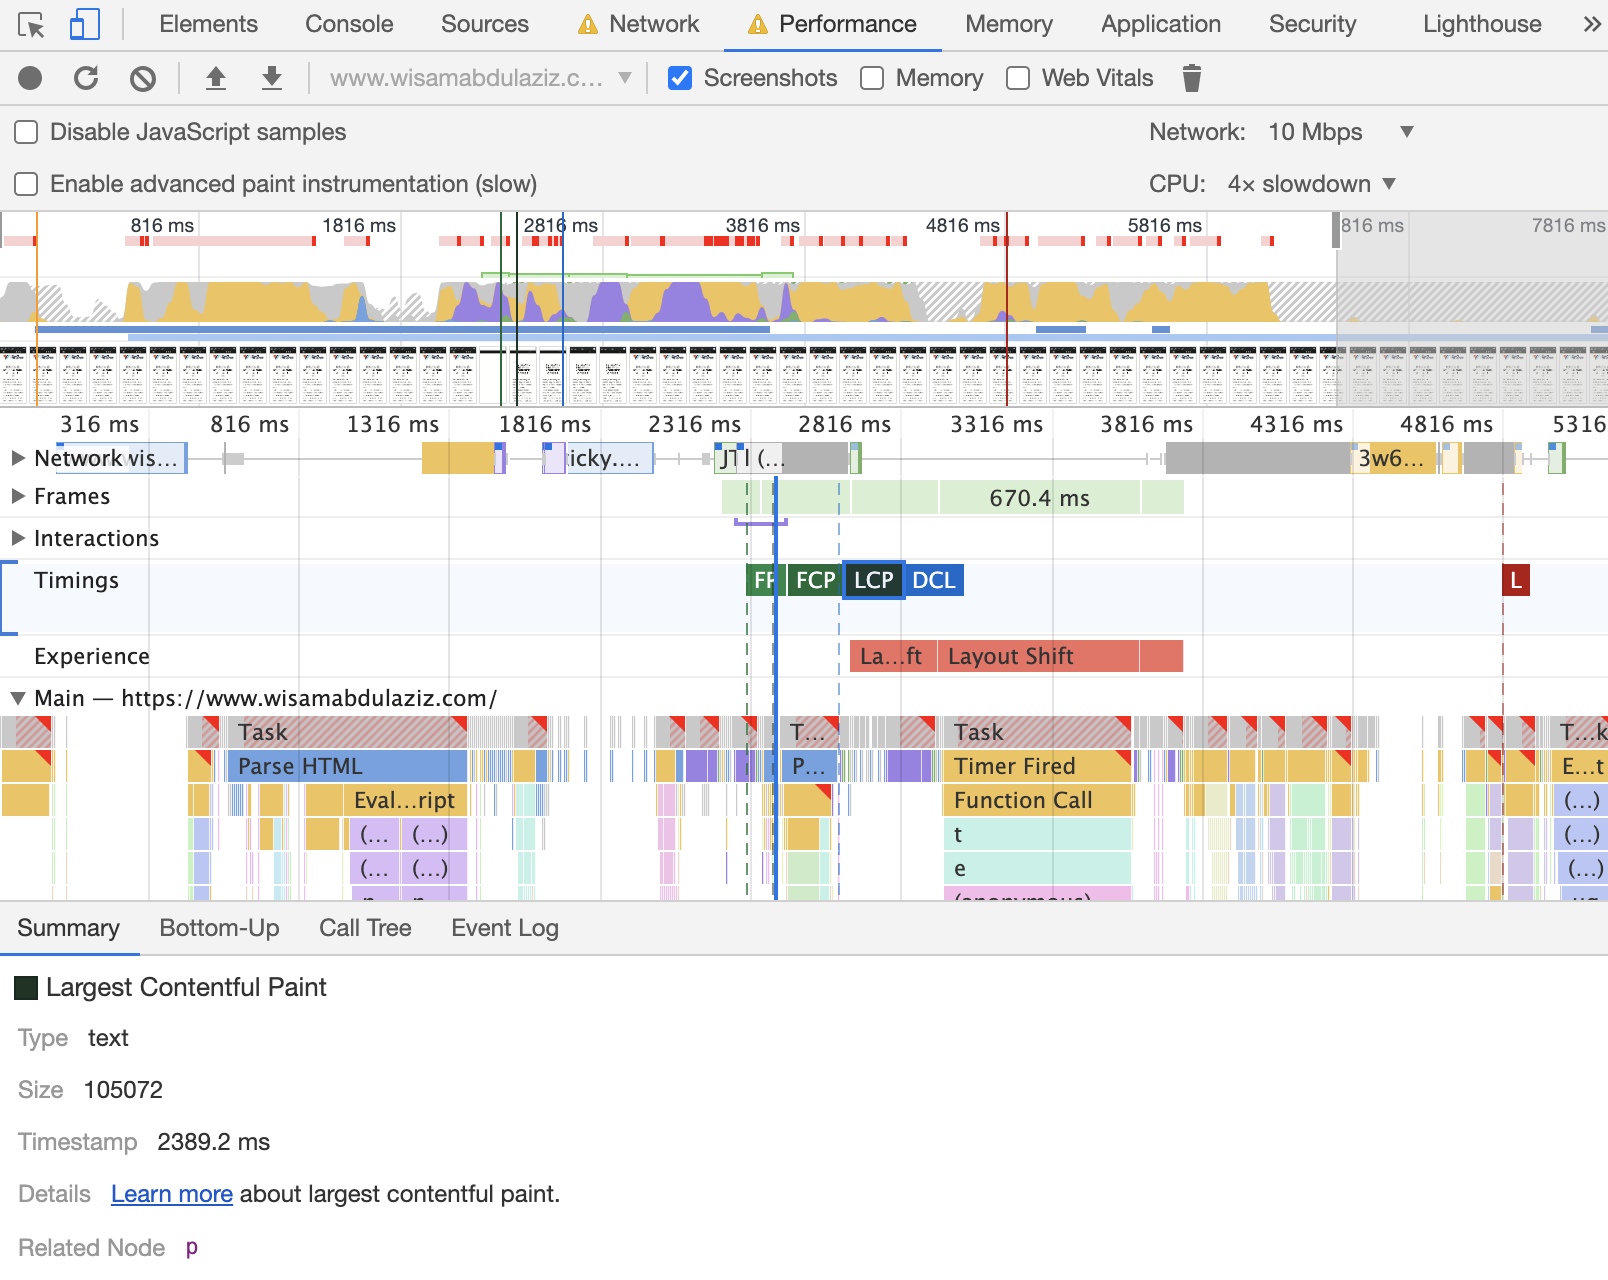
The best tool to measure and optimize for LCP is Google Chrome Developers Tools, the timestamp number represents LCP, the highlighted area marks the hero element that LCP is calculated when it finishes loading.
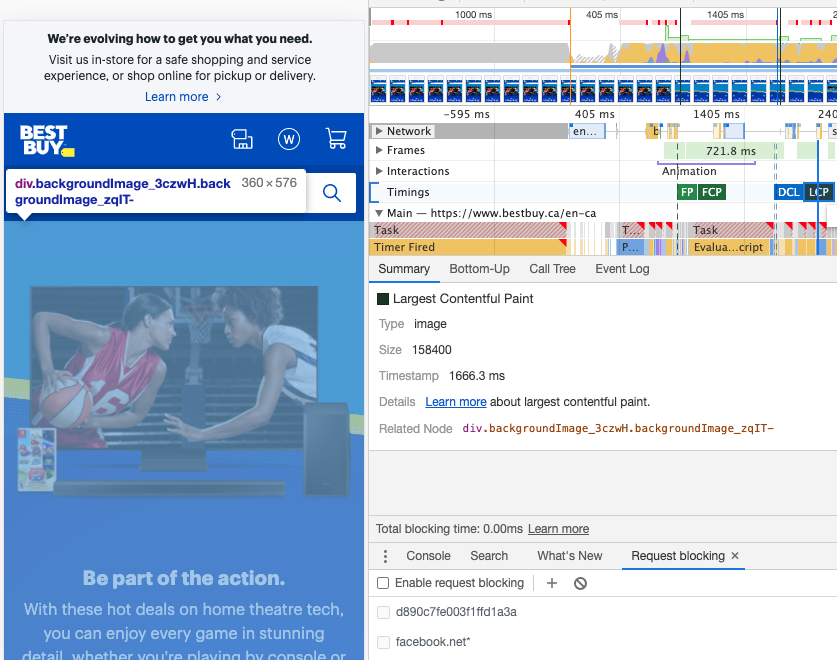
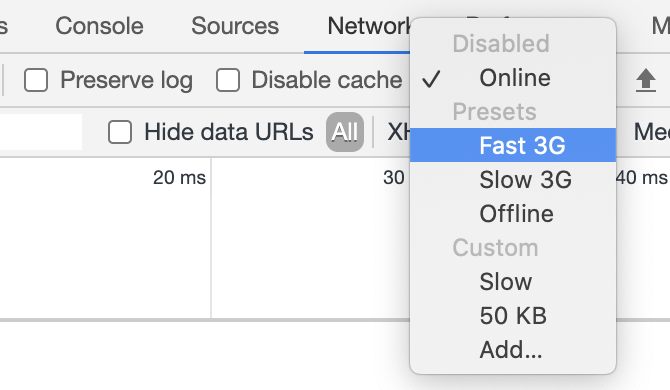
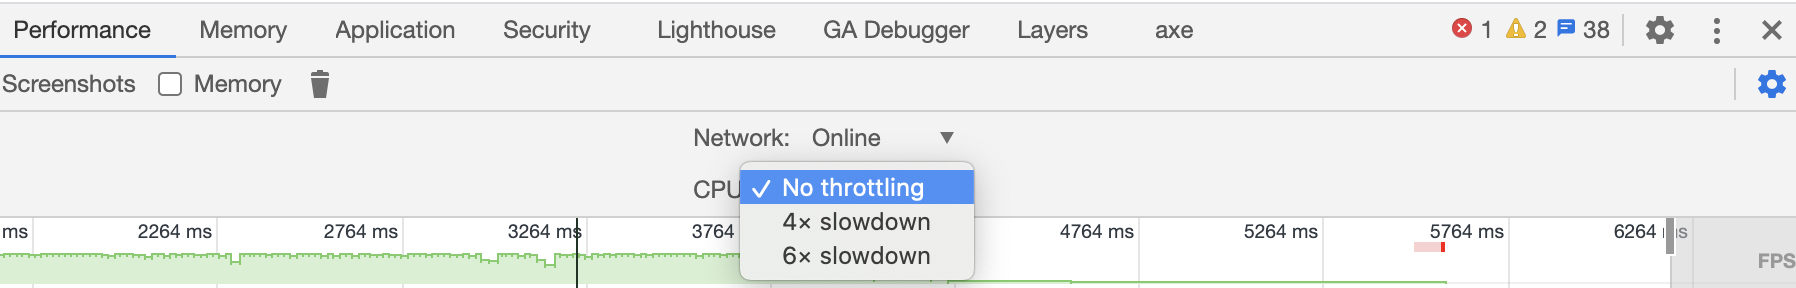
It is very important to run LCP test using different internet speed modes, and CPU speed modes, to better understand LCP value for different users based on their internet connection and machine power. Same thing applies to other Core Web Vitals and performance metrics.
How to optimize for LCP?
Optimizing for LCP is optimizing for speed, check my how to optimize for LCP post. A good start will be checking the recommendations provided by Lighthouse:

2- First Input Delay (FID)
"FID measures the time from when a user first interacts with a page (i.e. when they click a link, tap on a button, or use a custom, JavaScript-powered control) to the time when the browser is actually able to begin processing event handlers in response to that interaction."
Not all users will interact with your site every time they visit and the timing of the interaction is different, and not all interactions are relevant to FID. This means some users will have no FID values, some users will have low FID values, and some users will probably have high FID values.
FID is a metric that can only be measured in the field, as it requires a real user to interact with your page. You can measure FID only using Google Speed Insights tool, which is using Chrome User Experience Database, read here to better understand the difference between lab data and filed data. The good news that there is a lab metric (Total Blocking Time) that can help to diagnose and improve FID.
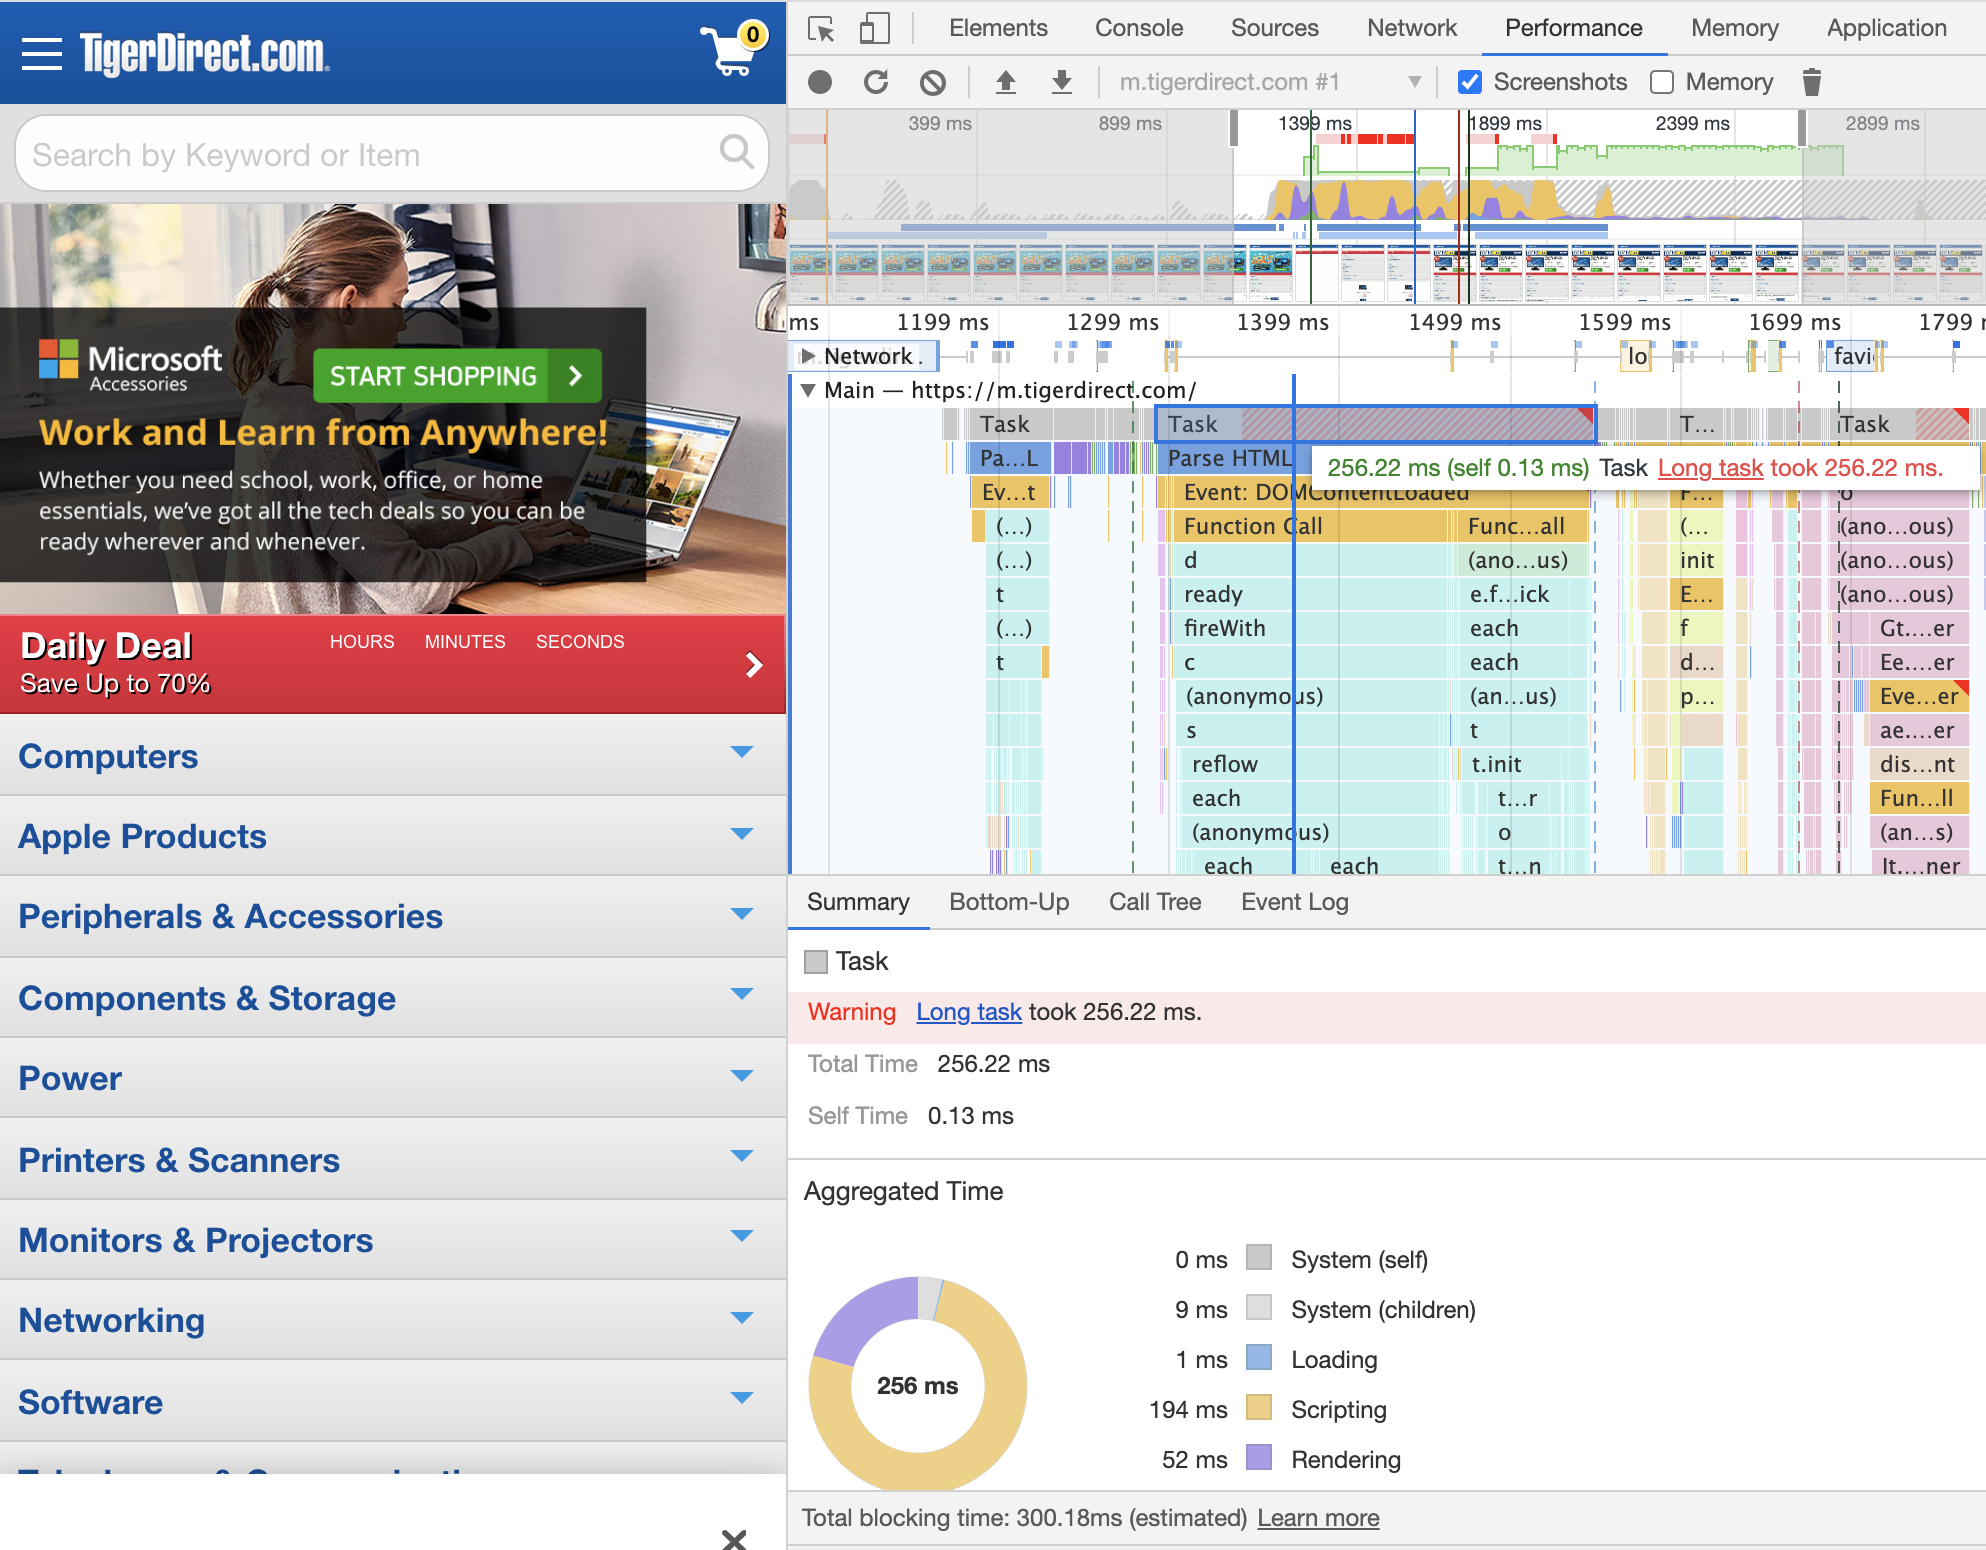
The Total Blocking Time (TBT) metric measures the total amount of time between First Contentful Paint (FCP) and Time to Interactive (TTI) where the main thread was blocked for long enough to prevent input responsiveness. No task should exceed 50 MS, Chrome Developers Tools provides total blocking time along with the tasks that are exceeding the 50 MS mark:
How to optimize for FID:
Optimizing for LCP includes lots of common elements that will improve FID, most common causes of high FID that needs to be worked on are:
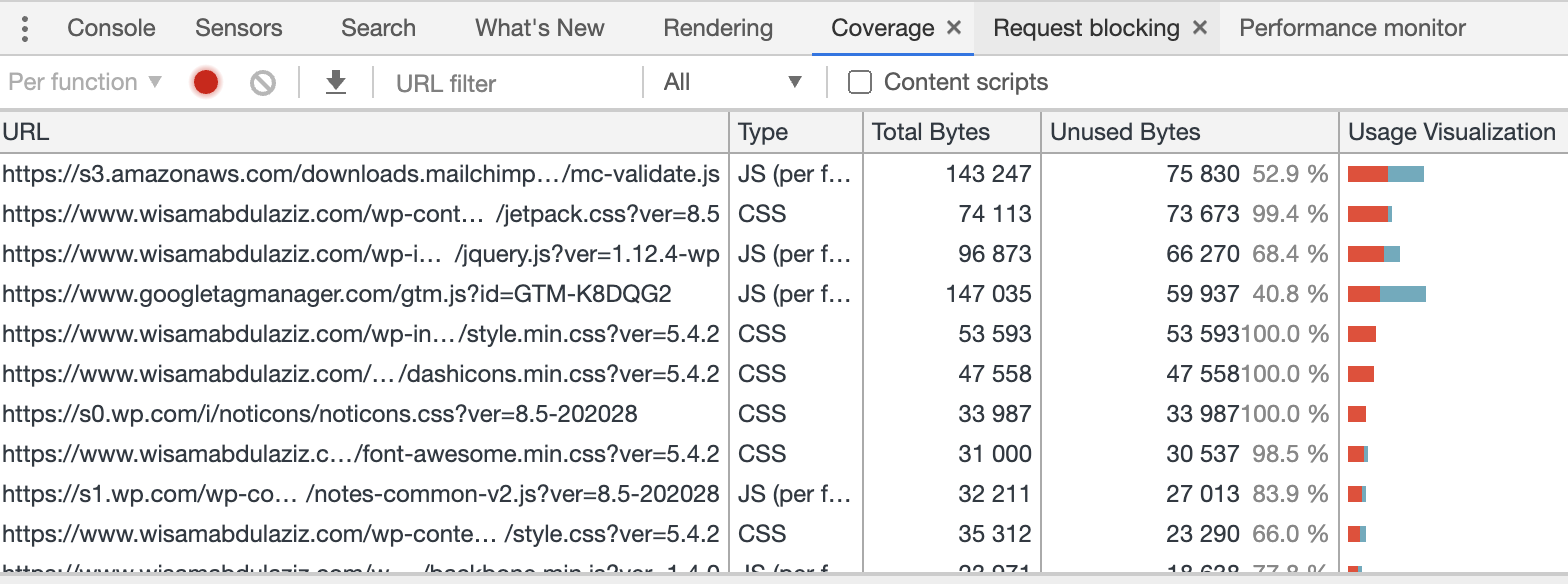
- Unnecessary JavaScript loading, parsing, or execution. While analyzing your code in the Performance panel you might discover that the main thread is doing work that isn't really necessary to load the page. Reducing JavaScript payloads with code splitting, removing unused code, or efficiently loading third-party JavaScript should improve your TBT score.
- Inefficient JavaScript statements. For example, after analyzing your code in the Performance panel, suppose you see a call to
document.querySelectorAll('a')that returns 2000 nodes. Refactoring your code to use a more specific selector that only returns 10 nodes should improve your TBT score.
3- Cumulative Layout Shift (CLS):
"CLS measures visual stability. Have you ever been reading an article online when something suddenly changes on the page? Without warning, the text moves, and you've lost your place. Or even worse: you're about to tap a link or a button, but in the instant before your finger lands—BOOM—the link moves, and you end up clicking something else!"
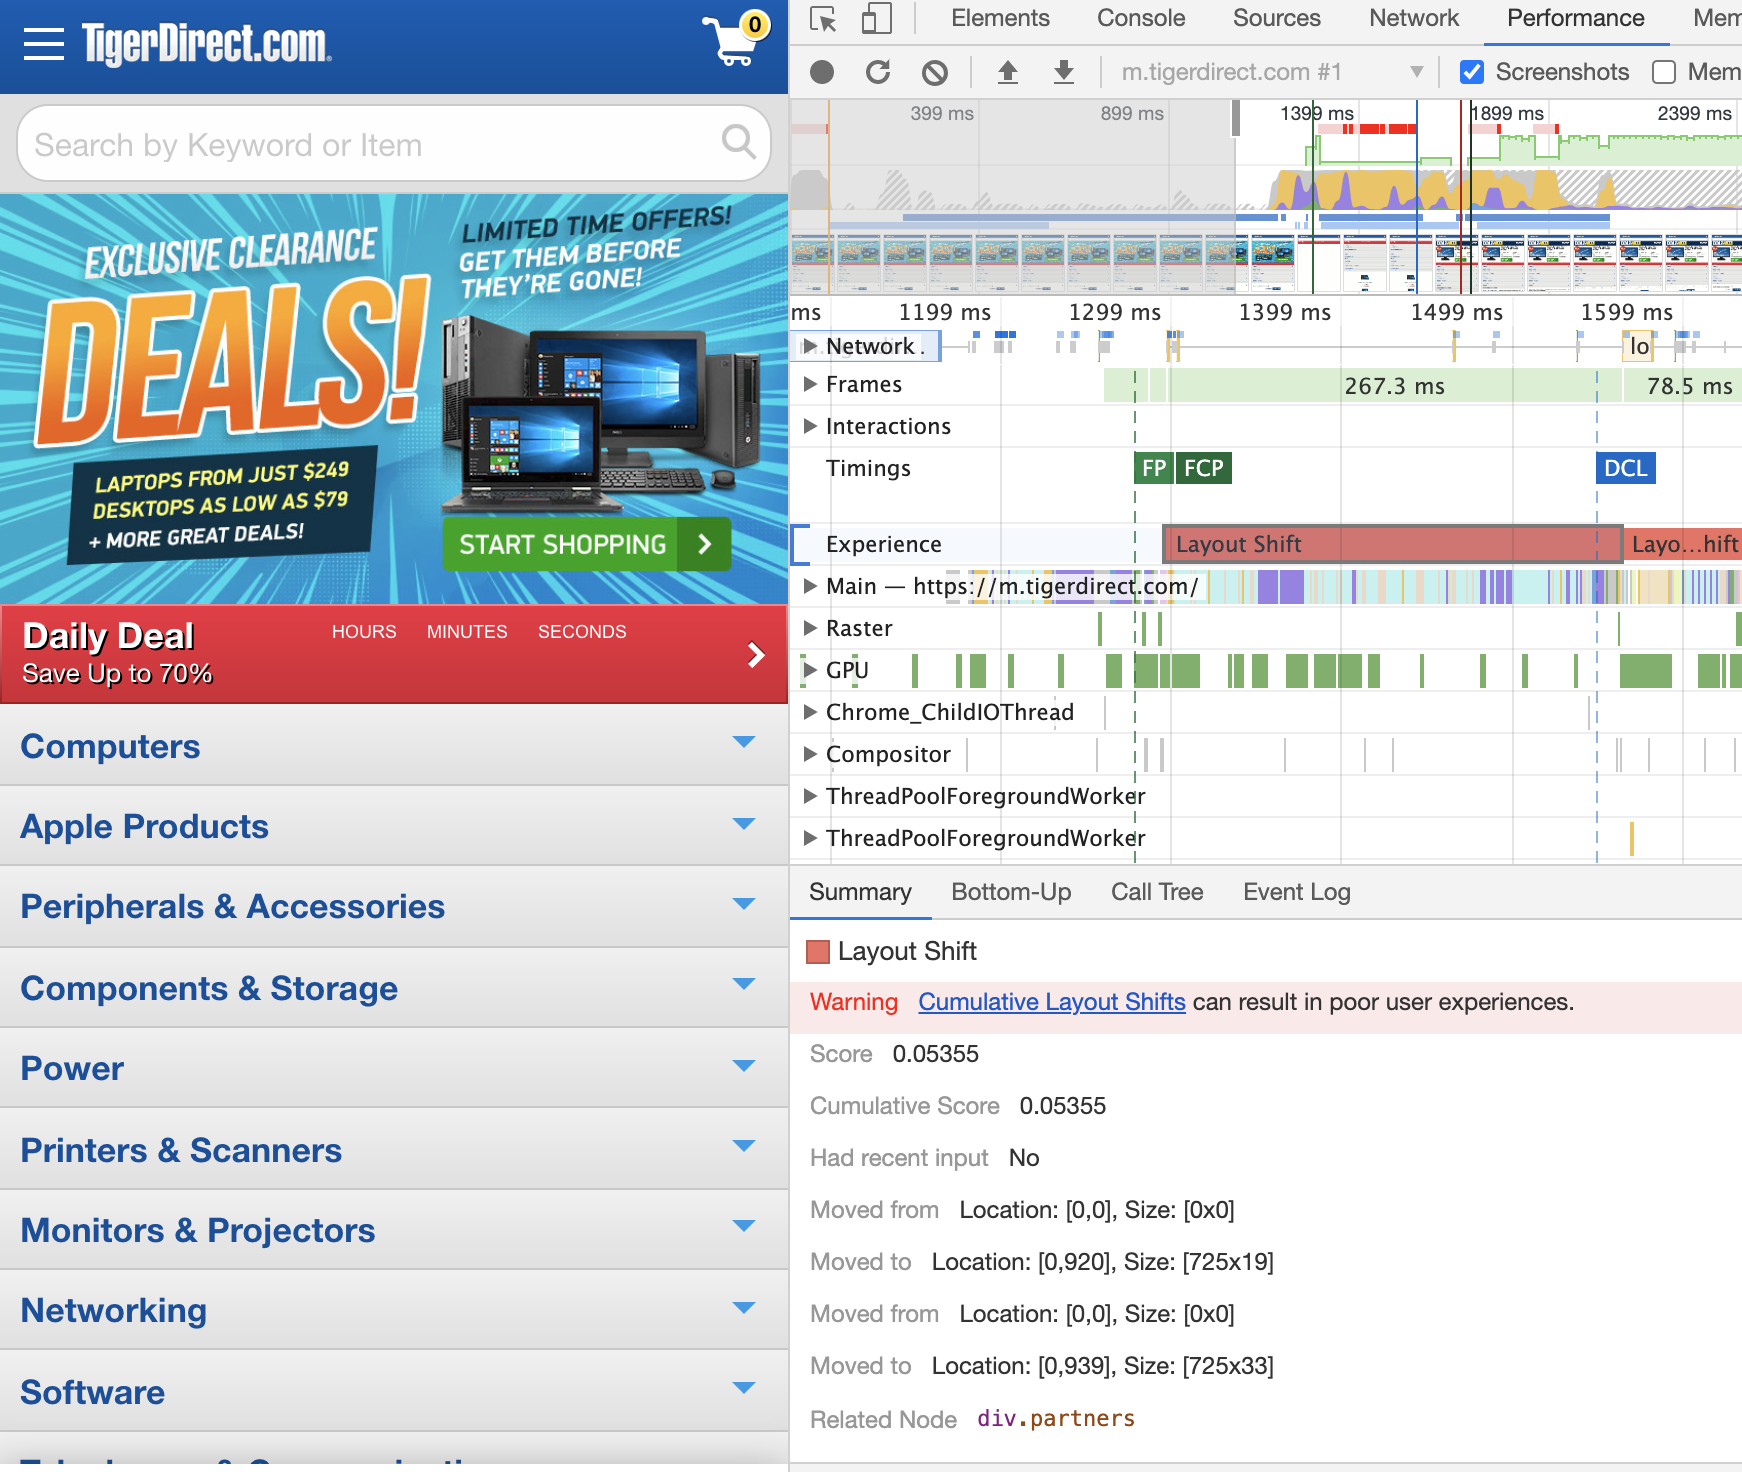
This could be the easiest Core Web Vital to diagnose, by looking at the thumbnails tracker in Chrome Developers Tools and enabling the Layout Shift Regions it should be easy to find out what is causing a high CLS:
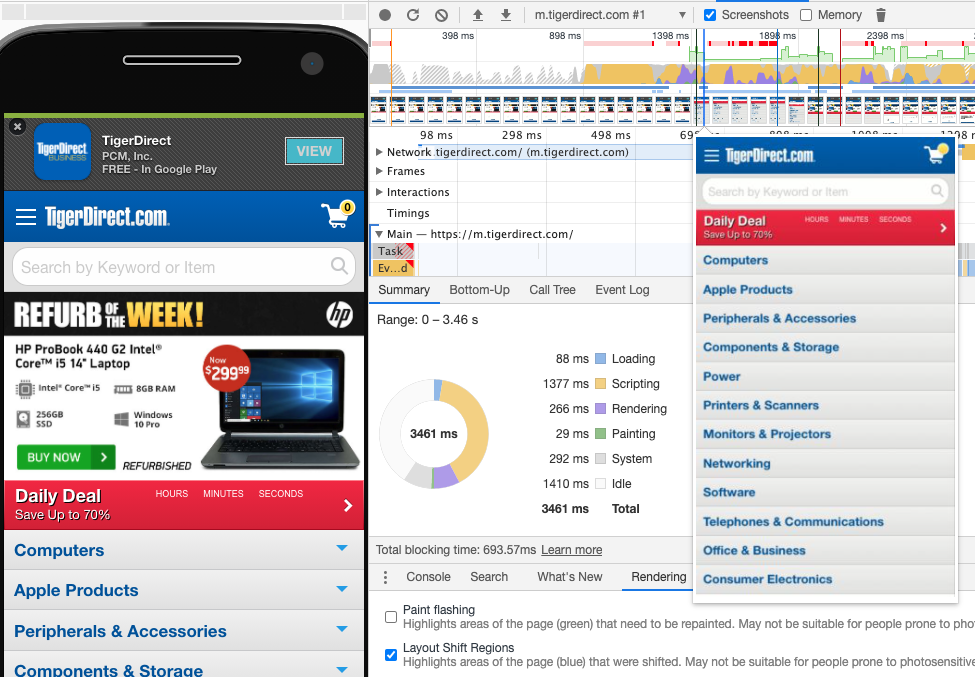
How to optimize for CLS?
CLS diagnosis and optimization could be the easiest among all Core Web Vitals, in most cases CLS issues are visible to the human eye, with some CSS and JS work, creating stability while the page is loaded should be achievable. Check the experience section in Chrome Developers Tools, and find which elements are moving and see if you can:
- Make them stable on the page
- Reserve a place holder for them from the beginning wile waiting for them to load.
CLS is measured for the entire life cycle of the page (even if it is kept opened for days by users), for that reason the actual user experience value could be different form Lighthouse or Chorome Developers Tools (where they measure only one trace).
The Marathon Of Good Core Web Vitals score:
Keeping a good Core Web Vitals score is a marathon that needs constant website improvements, there are too many variables that can change the score that used to be a pass before:
- Website technology changes (hosting and CMS) and content changes.
- Users technology changes (the type of machines and internet connection they use)
- Google changing their Core Web Vitals criteria and scoring
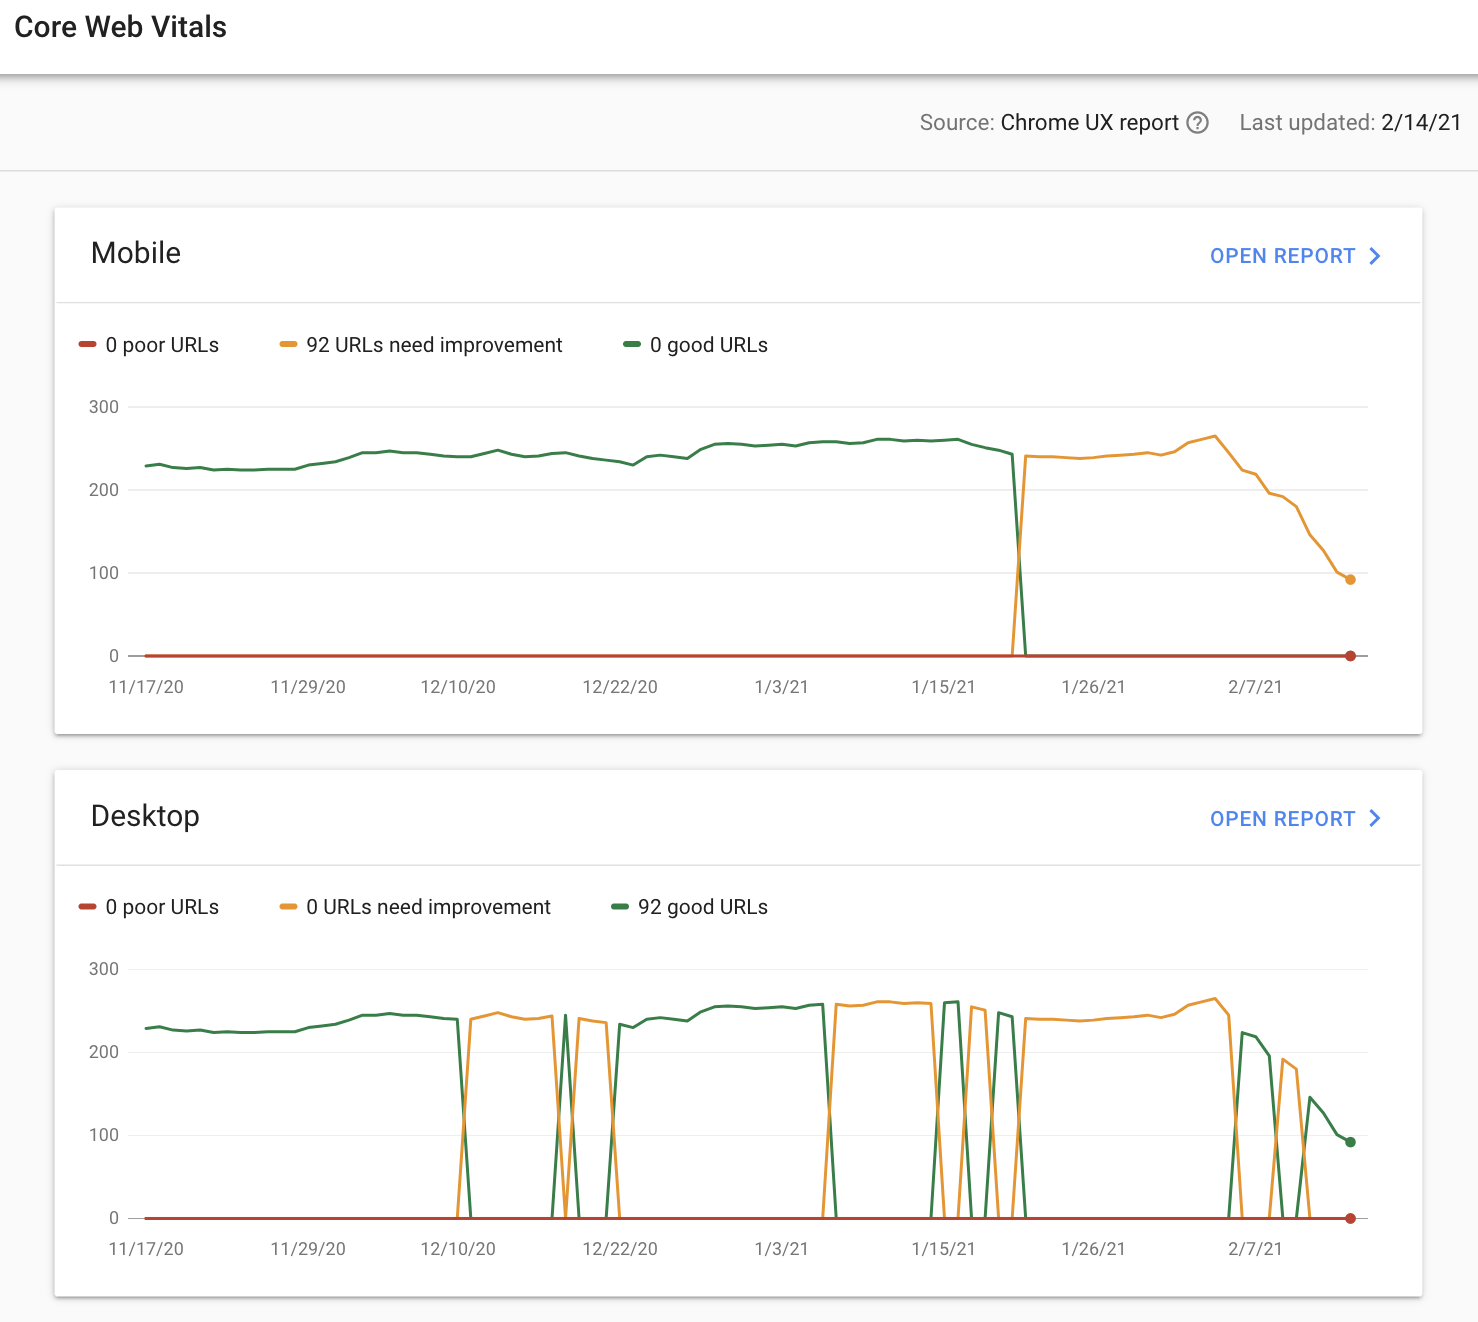
Monitoring the Core Web Vitals section in Google Search Console will be key to find any Core Web Vitals issues and start working on them as soon as they are detected.
Core Web Vitals improvement is not only a search engine best practice, it is also a user experience element that can lead to better a conversion rate.